Contour line generator
Draw an area and TOPOLUMA traces contour lines from the terrain model in your browser. Choose the interval, index lines, smoothing and labels, check the result on the map or in 3D, then take the lines into CAD or GIS.
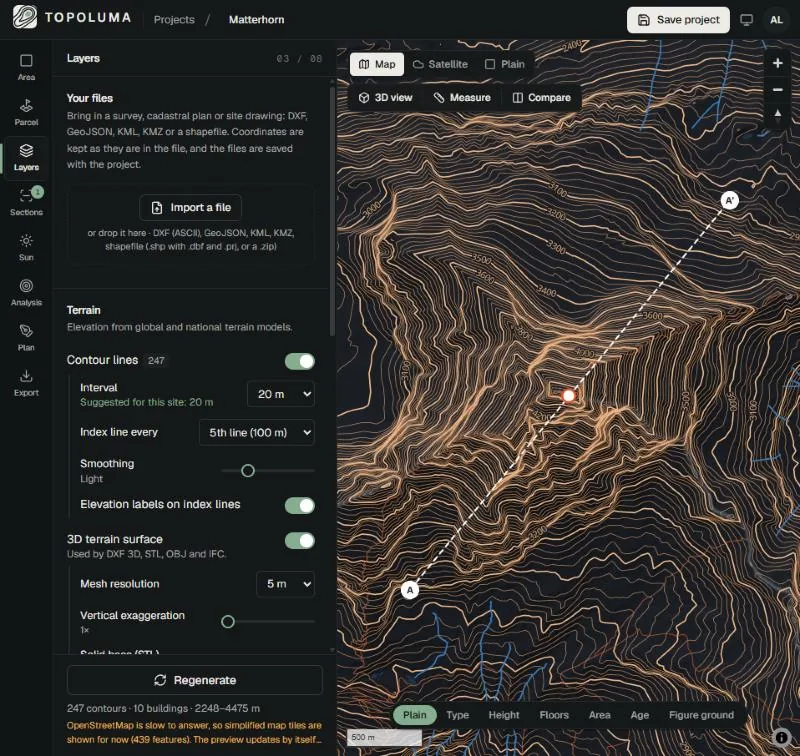
What you get
- Your interval
- From 0.25 m to 100 m, with an interval suggested from the relief of the area. Index lines every 2nd, 4th, 5th or 10th line.
- Readable lines
- Smoothing in steps from off to strong, and elevation labels along the index lines.
- At their height in CAD
- In DXF each contour is a polyline at its elevation on CONTOUR_MINOR or CONTOUR_INDEX, labels on CONTOUR_LABELS, so Civil 3D or Revit can build a surface from them.
- Paper and GIS
- True-scale PDF and SVG with a title block, north arrow and scale bar, or GeoJSON in WGS 84 with the elevation on every line.
Who uses it, and for what
- Architects. A contour base for site plans, sections and massing studies while the survey is still on its way.
- Landscape designers. See how a garden, park or slope falls before planning paths, terraces and planting.
- Engineers and planners. Contours for feasibility studies and route options, ahead of a survey.
- Students. Contours for a studio project site anywhere in the world, without installing GIS software.
How to do it
- Search the place and draw the area (up to 150 km²).
- In Layers, set the interval, index lines, smoothing and labels.
- Generate the preview and check the lines on the map or in 3D.
- In Export, choose DXF, PDF, SVG or GeoJSON and the coordinates, and download.
Limits to know
Contours are traced from the elevation model: about 30 m (Copernicus GLO-30) in most of the world, finer where an open national model exists. A fine interval over a coarse model looks precise but is interpolated, so it will not show terraces, retaining walls or small earthworks. It is a design base, not a survey. More on the data and accuracy page.
Questions
- How accurate are the contour lines?
- As accurate as the elevation model under them. In most of the world that is Copernicus GLO-30, a 30 m surface model, so errors of several metres are possible in steep or wooded terrain. Where an open national model exists, the source is much finer, down to about 1 m. Use the lines for design and context, and survey the plot before detailed design.
- Which contour interval should I choose?
- Start from the interval the studio suggests for the relief of your area, then check it against the drawing scale: lines closer than about 1 mm on paper start to merge. On 30 m data a very fine interval adds lines but not detail, because the extra lines are interpolated.
- Do the contours keep their elevation in AutoCAD and Civil 3D?
- Yes. In the DXF every contour is a polyline with its elevation as Z, on the CONTOUR_MINOR or CONTOUR_INDEX layer, so Civil 3D can build a surface from them. Labels are on CONTOUR_LABELS, so you can switch them off.
- Can I use the contours in QGIS or ArcGIS?
- Export GeoJSON in WGS 84. Every line carries its elevation as a property, so it can be styled or labelled by height straight away.
- How large an area can I draw?
- Up to 150 km². A smaller area gives a faster preview and a lighter file, so draw only what the drawing needs.